
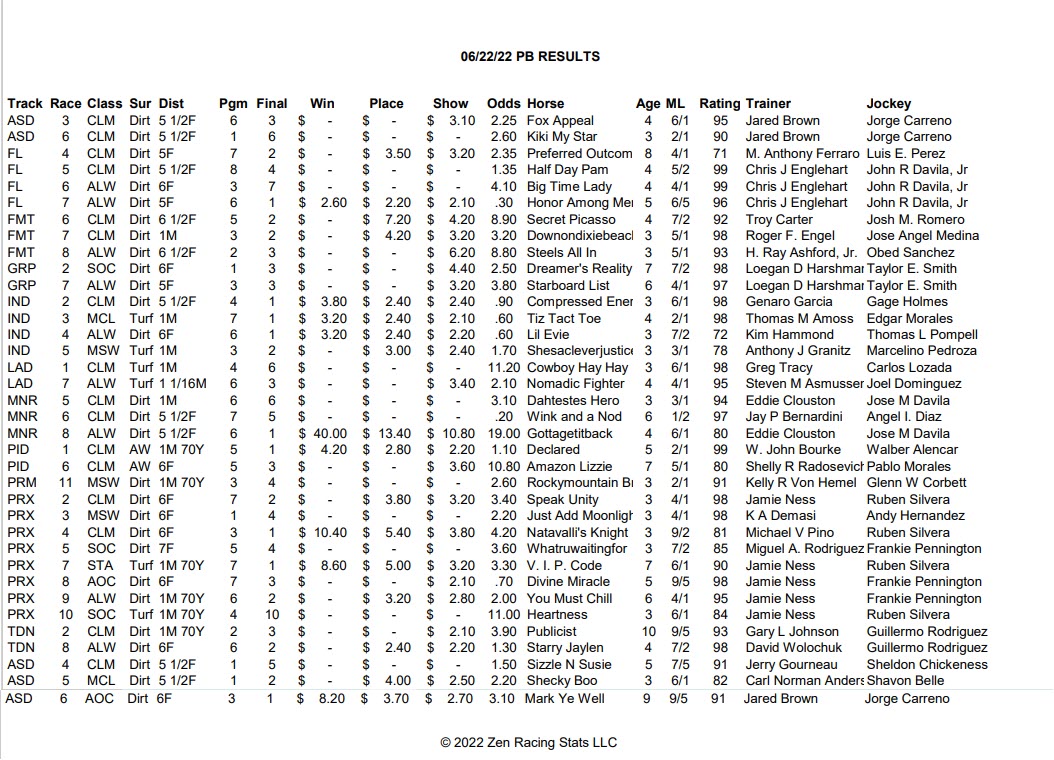
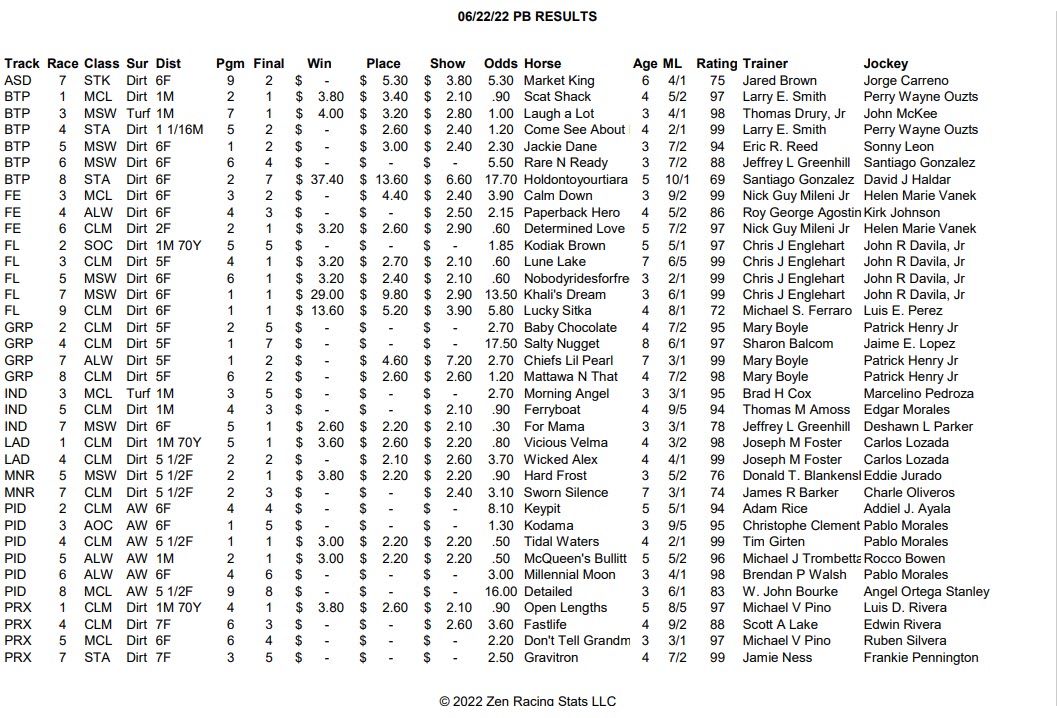
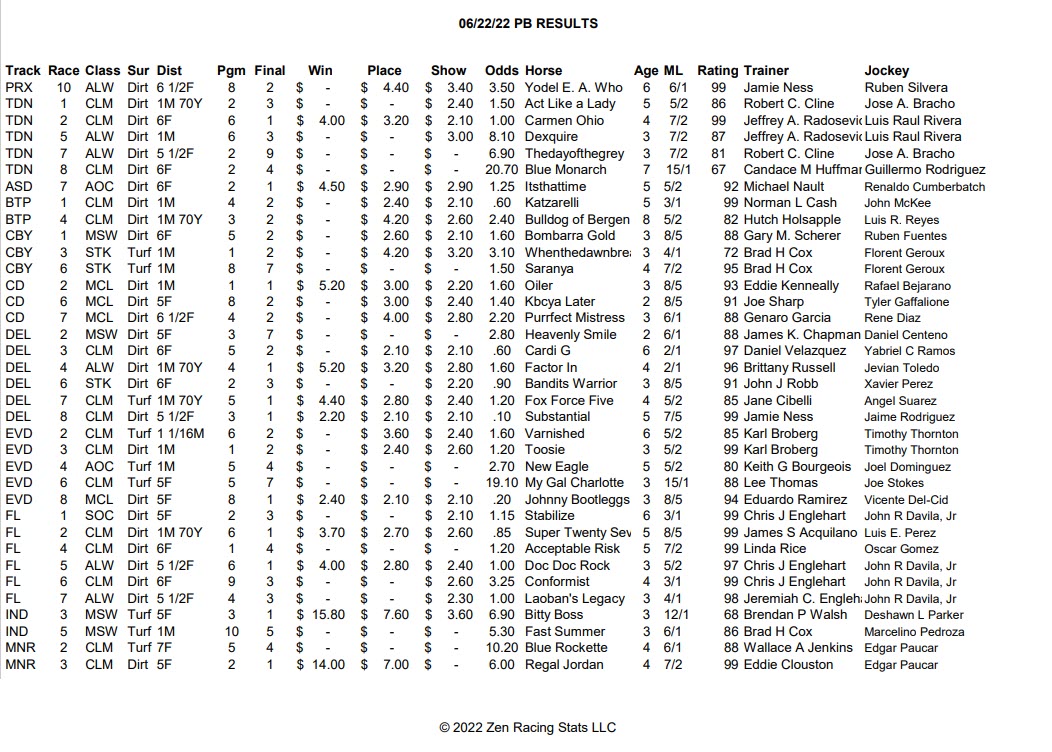
On Monday 6/20/22 we deployed Version 2 and in just three days of racing have experienced major progress to our betting program with the most noticeable improvement in the daily list of Potential Bet Summary reaching on average 30 to 40% winners and an overall on average in the money of 70% and if bet $2 to win, place and show on every runner that made the list (which we will never do because of weighing odds to percentages), we prove a flat bet profit betting all!
Let’s share this fantastic news again
Before Version 2 and from the dates of 11/28 through 4/5/22 there were 5,115 Potential Bets of which 1,358 of these won for a 26.5% win rate, 2,307 placed for a 45% place rate and 2,995 showed for a 58.6% show rate, however 33 of these did not offer investments on show bets leaving 2,962 having a payout. If we had placed $2 across the board on all 5,115, we would have invested $30,690 and received back $24,968.70 for an overall loss of $5,721.30 or 18.6%.
Since June 20th when Version 2 was deployed, even with several additional adjustments pending, the program listed 123 Potential Bets of which 39 won for an on average of 31% win rate, 30 placed for an on average of 24% place rate and 18 showed for an on average of 14.6% show rate for an overall on average 70% hit rate in the money. If we bet $2.00 across on all 123 (minus 4 races that did not offer a show payout) we would have wagered $730 and received back $805 for an overall flat bet Profit of $75 if bet all! 🙂 🙂 🙂

For a pdf version of Version 2 Potential Bet Results Report
Click Here
Keep in mind that during Version 1 I was unable to completely rely on the Potential Bet list to make our bets knowing that getting these base algorithms in place was the first step and adjusting and adding algorithms in later versions that define the hierarchy of each runners rating would substantially improve in later versions, so when I placed our wagers my selections were not exclusively from this list. I did however prove us profitable by making selections from Ed’s 4-race form cycle statistics displayed to me from the runners listed below the top pick.
To define, when a runner has a positive trainer or trainer/jockey move on one of Ed’s 4-race form cycle stats of Layoffs, Claims or Debuts, that runner receives a positive point in the hierarchy of things and so on and everything is specific to track, class, distance and surface and we realized going in that we could be tweaking the numbers too much though we’d know what adjustments to make by monitoring the results which had a big impact on the adjustments made for Version 2.
The ultimate goal for the Potential Bet list, that we are confident we will obtain in increments as we add algorithms to Versions is for the program to produce a daily report of the best investment opportunities for each day reaching 70 to 75% on average wins, that hit and profit from all odds levels.
The following is a list of what was in Version 1 followed by Version 2:
Version 1 includes:
Algorithms that are and always will be Specific to: Track, Class, Distance and Surface (soon to include surface condition)
Benter’s algorithms
Ed Bain 4-race form cycle algorithms for:
Layoffs
Claims
Debuts races
Jockey-Trainer statistics
Hierarchy by rating of Projected runners in order of finish for each race determined by the algorithms
Standouts (Potential Bet Summary)
The standouts is a list of the module selected runners who have an overwhelming (currently set at minimum of 10 point spread) rating higher than all other runners in any particular race.
Results
The ability to export all race results to spreadsheets for every thoroughbred track running in our database in order for us to monitor our progress and know what we should adjust.
Version 2 includes:
All within Version 1. Because as expected the results prove the settings too skewed, (a temporary ongoing occurrence through fruition) the adjustments in this version are as follows;
Change in distances.
Instead of specific to each distance we are separating and grouping together 5.5 furlongs and under, 6 furlongs through and including 7 furlongs, 7.5 furlongs through and including 1 mile 1/16, and 1 mile and 1/8 and longer.
Change is Class Grouping (in place of each specific to)
Allowance
Claims
Optional Claims
MSW
MCL
MOC
Age
Dissecting how mixed age groups perform within specific categories, 2 year olds alone, 3 year olds alone, 3 and 4 year olds, 3 4 5 year olds, 3 4 5 year olds and up within same race and 5 to 6 year olds and up in the same race.
Most important Change of all
Additional emphasis added to Ed’s 4-race form cycle statistics as the results show these as a good percentage portion of the wins.
Ed’s statistics are what I chose to bet in conjunction with a very select group from the Potential Bet list when using Version 1 and are the reason I was able to prove profitable before Version 2. Though I must say that I had to handicap for hours every day to accomplish this and knowing that this would all change with an influx of capital as progressing requires an influx is the very reason I switched gears to do so. And as previously stated I’ll remain quiet on this topic until the influx of capital is in hand.
